
Global Market Commentary – December 2020 Recap
Markets Hit New Highs in December
Domestic equity markets continued November’s astonishing returns and crested new highs in December to close out 2020. For the month of December, investors received the following presents:
- The DJIA finished December up 3.3%;
- The S&P 500 finished December up 3.7%; and
- NASDAQ finished December up 5.7%.
While December’s performance was impressive for its monthly returns, December also brought an end to Q4 and all of 2020 and the performance of the major U.S. indices for those two time-periods was just as impressive, maybe even more so. For Q4 and the 2020 calendar year:
- The DJIA added 10.2% in Q4 and rose 7.3% in 2020;
- The S&P 500 added 11.7% in Q4 and rose 16.3% in 2020; and
- NASDAQ added 15.7% in Q4 and rose 43.6% in 2020.
The themes that drove the markets were positive economic data, talk of another stimulus package and the first COVID vaccines being distributed around the world. Yes, there was more election noise throughout the month, but that played less of a role versus the month before.
Wall Street and Main Street also held their collective breath until President Trump signed the $900 billion COVID-relief bill, which will provide much-needed relief to small businesses and direct payments to individuals and families. And while there was hope that those payments might be increased to $2,000, those hopes were put on hold until at least 2021.
- Volatility, as measured by the VIX, trended modestly higher, beginning the month just north of 21 and ending just shy of 23.
- West Texas Intermediate crude trended up in December as it did the month before, adding about $3/barrel over the month to close out 2020 at $48.52/barrel.
Market Performance Around the World
Investors were thrilled with December’s performance, as all 35 of the developed markets tracked by MSCI were positive for the month of December, as they were in November too. And of the 40 developing markets tracked by MSCI, all of them were positive too, as they also were in November.
Index Returns | December 2020 |
MSCI EAFE | +4.56% |
MSCI EURO | +3.93% |
MSCI FAR EAST | +4.08% |
MSCI G7 INDEX | +4.04% |
MSCI NORTH AMERICA | +3.95% |
MSCI PACIFIC | +4.39% |
MSCI PACIFIC EX-JAPAN | +5.21% |
MSCI WORLD | +4.14% |
MSCI WORLD EX-USA | +4.45% |
Source: MSCI. Past performance cannot guarantee future results
Sector Performance Rotated in December
The overall trend for sector performance for each of the 12 months was mostly good, but the performance leaders and laggards did rotate all year.
Here are the sector returns for the shorter time periods:
S&P 500 Sector | December 2020 | 2020 |
Information Technology | +5.68% | +42.21% |
Energy | +4.27% | -37.31% |
Health Care | +3.74% | +11.43% |
Real Estate | +0.92% | -5.17% |
Consumer Staples | +1.45% | +7.63% |
Consumer Discretionary | +2.45% | +32.07% |
Industrials | +1.12% | +9.01% |
Financials | +6.05% | -4.10% |
Materials | +2.31% | +18.11% |
Communication Services | +3.07% | +22.18% |
Utilities | +0.42% | -2.83% |
Source: FMR
Reviewing the sector returns for just the month of December 2020 and for all of 2020, we saw that:
- All sectors were painted green for the month of December;
- The Financials sector was the best performer for the month, helped by the Federal Reserve’s stance of keeping rates low through 2023;
- While the Energy sector turned in another positive month, it was nowhere near enough to override its annual loss of more than 37%;
- The differences between the best performing and worst performing sectors in December was tighter than it has been past few months; and
- On an annual basis, however, the differences between the best and worst performing sectors is dramatic, as the Information Technology sector is up over 42% YTD and Energy is shockingly down over 37%.
How is this for Sector Rotation?
- At the end of October, there were 7 sectors with negative YTD performance; and
- At the end of November, there were 7 sectors with positive YTD performance; and
- At the end of December, there were 7 sectors with positive YTD (annual) performance.
December’s Uncertainty
As December wrapped up, investors were thankful that the two dominating news events of 2020 also drew to a close, as the outcome of the presidential election and more certainty with respect to a COVID-19 vaccine came into focus.
Nevertheless, there was a lot of economic data that painted a conflicting picture and to many, the disconnect between the stock market and the current economy was disconcerting at times and difficult to reconcile.
Yes, the stock market looks forward and Wall Street will be quick to suggest that current valuations, lofty stock prices and new stock market records are justified, but Main Street is having a harder time digesting that theory. Especially since it appeared that for every positive economic data point, another negative one (if not two) was announced.
GDP Skyrockets (sort of)
Three days before Christmas, the U.S. Department of Commerce released the “third” estimate of real gross domestic product for the third quarter and the “third” estimate was revised upwards from 33.1% to 33.4%. This is of course on the heels of the 31.4% decrease in the second quarter.

According to the Bureau of Economic Analysis (within the Department of Commerce):
“The increase in real GDP reflected increases in PCE, private inventory investment, exports, nonresidential fixed investment, and residential fixed investment that were partly offset by decreases in federal government spending (reflecting fewer fees paid to administer the Paycheck Protection Program loans) and state and local government spending. Imports, which are a subtraction in the calculation of GDP, increased.
Consumer Confidence Dips (duh)
Every month, the Conference Board, in conjunction with Nielsen, compiles a survey of consumer attitudes on the economy in order to create its Consumer Confidence Index, which captures “consumers' perceptions of current business and employment conditions, as well as their expectations for six months hence regarding business conditions, employment, and income.”
From the release dated December 22nd (which was also the same day as the new GDP numbers were released), it was reported that the Conference Board Consumer Confidence Index declined in December, after also decreasing in November.
- The Index now stands at 88.6 (1985=100), down from 92.9 in November.
- The Present Situation Index – based on consumers’ assessment of current business and labor market conditions – decreased sharply from 105.9 to 90.3.
- The Expectations Index – based on consumers’ short-term outlook for income, business, and labor market conditions – increased from 84.3 in November to 87.5 this month.
“Consumers’ assessment of current conditions deteriorated sharply in December, as the resurgence of COVID-19 remains a drag on confidence,” said Lynn Franco, Senior Director of Economic Indicators at The Conference Board. “As a result, consumers’ vacation intentions, which had notably improved in October, have retreated. On the flip side, as consumers continue to hunker down at home, intentions to purchase appliances have risen. Overall, it appears that growth has weakened further in Q4, and consumers do not foresee the economy gaining any significant momentum in early 2021.”
Inflation Appears Muted (somewhat)
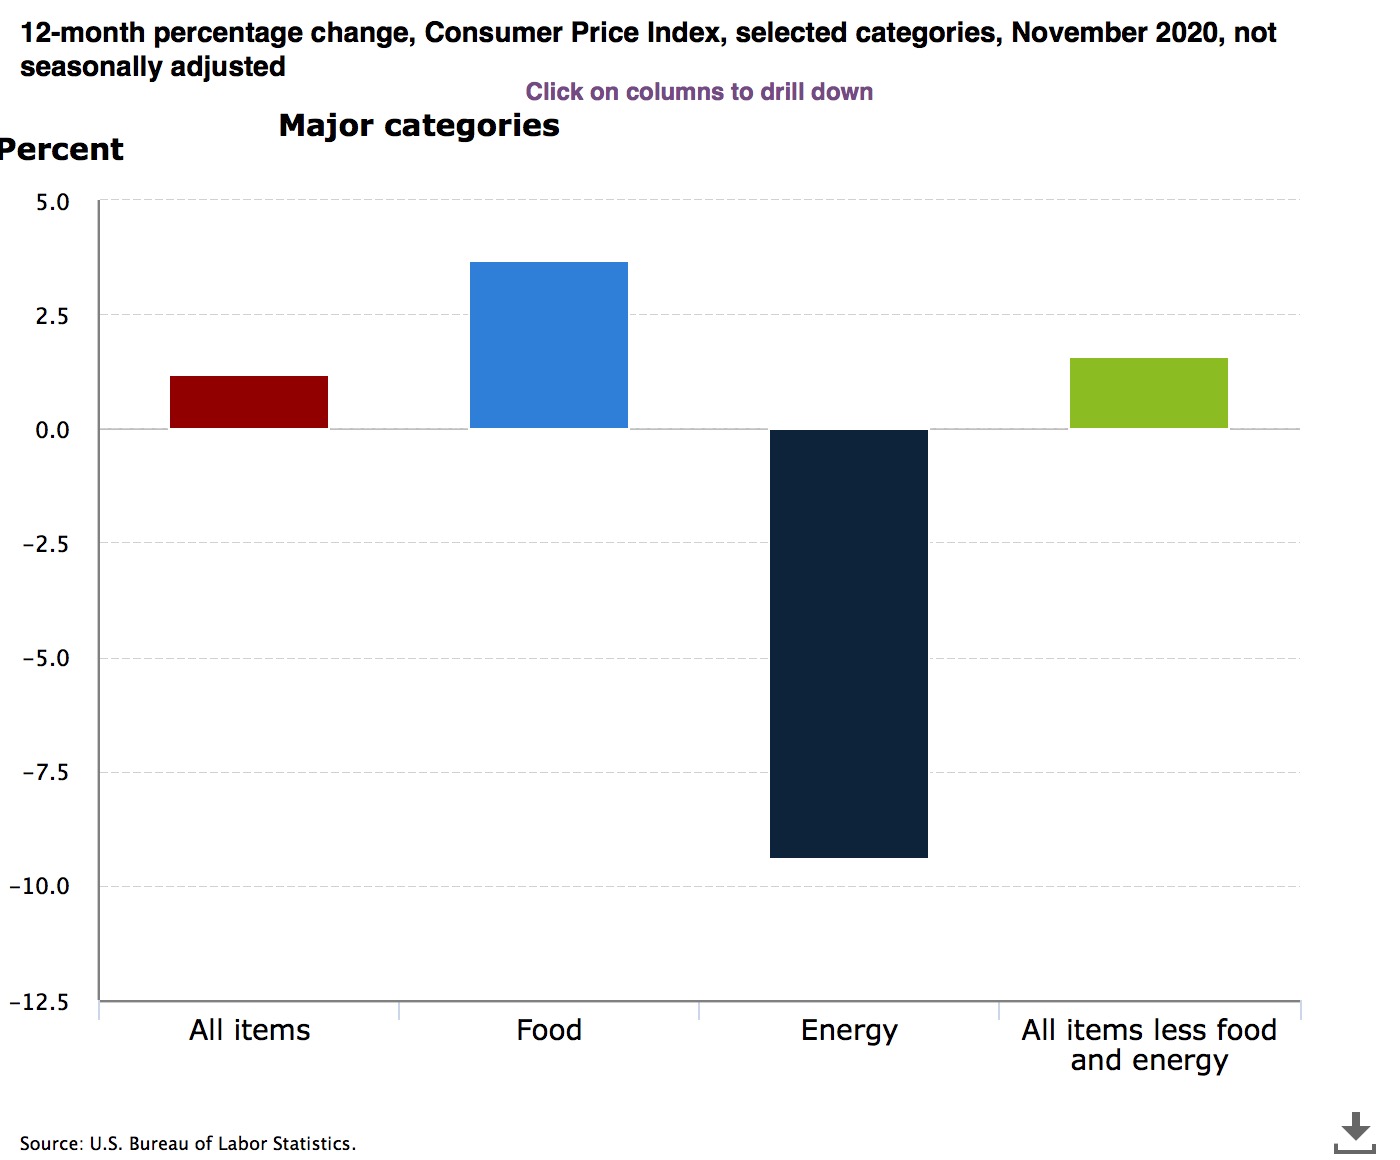
The U.S. Department of Labor reported on December 10th that the Consumer Price Index for All Urban Consumers increased 0.2% in November.
From the BLS press release:
“Over the last 12 months, the all items index increased 1.2 percent before seasonal adjustment. The seasonally adjusted increase in the all items index was broad-based, with no component accounting for more than a quarter of the increase. The food index declined in November, as a decrease in the food at home index more than offset a small increase in the food away from home index. The index for energy rose in November, as increases in indexes for natural gas and electricity more than offset a decline in the index for gasoline.”
The following chart shows the 12-month change in CPI:
Existing-Home Sales Fall (surprisingly?)
On December 23rd (again, the same day as GDP and CPI numbers released), the National Association of Realtors reported some not-so-rosy housing statistics:
“Existing-home sales fell in November, snapping a five-month streak of month-over-month gains, according to the National Association of Realtors. All major regions either took a step back or held steady in terms of their respective month-over-month status, but each of the four areas experienced significant year-over-year growth.”

The good news was that total sales were up almost 26% from a year ago and that the median sales price shot up over 14% in the past year.
Pending-Home Sales Fall (also surprisingly?)
Then a week later on December 30th, the NAR reported that pending home sales declined in November, with month-over-month activity declining across the country.
- The Pending Home Sales Index, a forward-looking indicator of home sales based on contract signings, fell 2.6% to 125.7 in November, the third straight month of decline.
- Year-over-year, contract signings climbed 16.4%.
- An index of 100 is equal to the level of contract activity in 2001.

Sources: bea.gov; conference-board.org; nar-realtor; msci.com; fidelity.com; nasdaq.com; wsj.com; morningstar.com
Copyright © 2021 Financial Media Exchange LLC. All rights reserved. Distributed by Financial Media Exchange.
Nothing contained herein shall constitute an offer to sell or solicitation of an offer to buy any security. Material in this publication is original or from published sources and is believed to be accurate. However, we do not guarantee the accuracy or timeliness of such information and assume no liability for any resulting damages. Readers are cautioned to consult their own tax and investment professionals with regard to their specific situations.